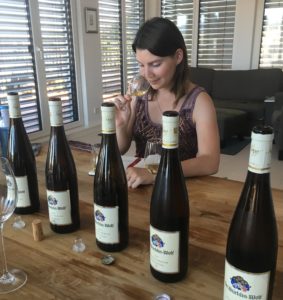
As my first year studying International Wine Business at Hochschule Geisenheim University in Germany comes to an end, I would like to share some of the topics I have learned as I prepare for final exams. Today’s 4-11 on university wine studies: sensory evaluation.
Have you ever wondered just how wines are evaluated? Where do the ratings come from? How accurate/bias are they? What do they mean? It seems like the job of a lifetime to sit in a chair, handed glass after glass of wine, and asked to proclaim your verdict. Sign me up! But there is in fact a little more to it.
Now hang on to your wine glass, because I’ve got a lot to say.

Sensory evaluation gives you the “whole picture” of the wine beyond the chemical analysis. Integral to quelling subjectivity and encouraging reproducibility in wine assessors’ evaluations are (1) standardization in sensory evaluation procedures; (2) training; and (3) large enough panel size for the purpose at hand.
Anatomy
Before delving into the numerous tests used in sensory evaluation, you must understand the anatomy of the human senses – sense of taste and smell specifically, and sight to a lesser extent.
Sense of Taste: GUSTATORY
Our taste buds can perceive sweet (sugar), salty (sodium chloride), sour (citric acid), and bitter (caffeine). These are the only tastes the tongue can determine (except perhaps umami and metallic). Hints of apple, jasmine, oak, and green pepper (as examples) in wine talk comes from elsewhere (I’ll get to that). The intensity of taste depends on the concentration, temperature, dimension of stimulated area, and length of stimulation. Warm solutions intensify sweet, and cold solutions intensify salt and bitter tastes. To test your ability to recognize and name sugar, sodium chloride, citric acid, and caffeine tastes, you start with a chart with 4 columns representing sweet, salty, sour, and bitter. You are given samples of sugar, sodium chloride, citric acid, and caffeine solutions in different concentrations and asked to identify each as sweet, salty, sour, or bitter in the chart. Easy as it sounds, it’s harder than it seems and takes some training.
Sensitivity Threshold Test: Are you a “Super Taster”?
Use: Obviously, people who are more sensitive to taste are the most useful in tasting evaluations. Ones threshold for taste sensitivity can be determined through a sensitivity threshold test.
Application: To test this you are given solutions of sugar, sodium chloride, citric acid, or caffeine at increasing concentrations to taste. Step 1: Perhaps at first you can’t taste anything by pure water, and you mark “0” for solution 1. Step 2: Then maybe at solution 3 you recognize that it is not just water, that there is some sort of taste stimulation, but you can’t identify if it is sweet, salty, sour, or bitter just yet, and you mark “X”. Step 3: You recognize the taste as (example) bitter and mark “XX”. Step 4: If you recognize an increase in the intensity/concentration of the (bitter) taste, you mark a “XXX”. Step 5: Ultimately, as the concentration increases to the point of saturation and you can no longer identify further intensity increases, you mark “XXXX”. How did you do? You compare your results to the known sensitivity thresholds of sugar, sodium chloride, citric acid, and caffeine concentrations and see how close you were. As I learned from this test in class, apparently caffeine can be detected at 0.1g/l.
Trigeminal Sensations: SOMATOSENSORY
This is the multimodal nerve system responsible for our sense of pain, thermal stimulation, and tactile qualities, for example sparkling, astringent, cooling, spicy sensations. The sensations go to the mouth, the nose, the eyes, and then to the brain.
But how’s this for a curveball? – Our retro-nasal reception (“smell”) actually accounts for 3/4 of taste perception! So much for the attention given to our taste buds after all!
Sense of Smell: olfactory
The physiology of our sense of smell comes from olfactory cells in our nasal cavity. We smell through our mouths too. This is what is known as retro-nasal smelling. Together these two avenues for sensing smells is called the Gustatory-Olfactory system. In essence, smell is a chemical processes, where molecules in the air/food are identified by our olfactory cells and we perceive it as taste. It means that when you detect notes of apple in your wine, you are actually tasting sweet and sour on your tongue, and smelling all the chemical molecules associated with apples. Trippy.
We have lost some sense of smell through evolution, but it was designed as a way to warn humans against dangers by arising disgust, or produce delight and cause salivation and hunger. It was Humankinds primitive guide book for wilderness survival. We connect smells to other senses too, such as emotional, visual, and taste. Fun facts: the best smellers are between 30-40 years old, puberty and medicine changes our sense of smell, and colours can even have smells and flavour associations. Also, the human sense of smell is feeble compared to other animals.
There are about 500 aromatic components in wine, but generally humans can only recognize the dominate few substances. A gas chromatography-olfactometry machine can deduce the exact chemical substances in a solution that we associate with different smell-tastes. Standardization of aromatic substances, where only single chemical substances are used in a solution, is actually not used so much in the wine world. Because wine evaluators must train and learn to recognize aromas in wine, not just single chemical substances, whole ingredients (apple, orange peel, etc) are added to a solution, which is comprised of hundreds of chemical compounds, and is thus non-standardized from sample to sample.
Sense of sight: optical
To put it simply, our eyes have rods that perceive light but no colour, and cones that perceive colour and movement. As I mentioned earlier, colours can influence taste and smell (richer colours = riper). Colours also have emotional associations (black = serious). These visual perceptions can influence our evaluation of a wine, so sometimes the colour of wine is masked in tastings. Our colour memory is also very weak compared to our sense of smell, so it’s just as well. Other times, however, the colour is an important aspect of evaluation tests.
Differentiation/Discrimination Tests
Tests that fall under this category are only interested in if the samples given are different. The differentiation can be one-sided, generally identifying which sample is different, one-sided according to whether a specific attribute is different, or two-sided asking which sample the assessor prefers. These tests are all useful for testing if altering ingredients, processing, etc. influences the product, but only the A not A test is useful in researching consumer behaviours and the In-Out test for quality control.
Pairwise COMPARISON
Use: For small differences between 2 samples. These samples are not identical, but similar. Can ask a specific attribute one-sided question – e.g. which is the sweetest? Or can ask the two-sided question – which do you prefer? Useful, for example, when testing a non-name brand version of a product/ product alteration. In this case it is often good when panelists can’t tell the difference. Can also be used to test the sensitivity of the panelists. In this case you want them to correctly identify one sided answers on a reliable basis.
Application: Trying 2 similar samples next to each other as many times as necessary. Problem with one-sided questions is that you have a 50% chance to get the answer right all the time, you are also forced to choose an answer regardless if you can detect a difference. In order to get statistically assured results, more assessors and the use of identical pairwise samples to firmly test the results the assessors are required. On the other hand, this test is easy to prepare and quick.
Triangle
Use: Out of 3 samples, where 2 are identical and 1 is different, the assessor can be asked the general one-sided question – which is the different/odd sample? This is not linked to a specific attribute. In an Extended Triangle Test, the question can be two-sided – which do you prefer? This is only done if the results from the Simple Triangle Test are statistically significant. In addition, a 2/5 Test could be used, where 2 samples are the same and 3 are different, but it not the popular choice of test. Like the Pairwise tests, these Triangle tests can also be used to test changes in recipe, processing, etc.
Application: Trying 3 samples side by side as many times as necessary, where each sample has a 3-digit number associated with it and each panelists receives the samples in a different order. With this test the assessors have a 33% chance to guess the correct answer. It also means that the assessors are forced to choose a sample even if they can’t distinguish a difference. The 2 identical products must be homogenized prior to panel testing. In the case of wine this means that the two identical bottles must be mixed with each other and then redistributed into 2 bottles. This creates more preparation work. Also, the use of enough panelists (minimum 6, but 12 or 18 is much better) and samples to create a “Latin Square” where all possible combinations are represented is important. Finally, there can be varying degrees of statistical significance in the findings – 95%, 99%, and 99.9% – depending on how many tasters got the correct answer.
“If 13 (or 14, 15, etc.) assessors got the correct answer, then the assessors are able to detect the single different substance with 95% (or 99% or 99.9%) statistical significance.”
3 AFC (three Alternatives forced choice)
Use: Like a combination of Triangle and Pairwise tests, 3 AFC comprises of 3 samples, where 2 are identical and 1 is different, but this time asks a one-sided specific attribute question – e.g. which one is sweeter? This is actually used if the Triangle test was unsuccessful to guide tasters more and produce results.
Application: Same set up as the Triangle test (3 samples, 3-digit number, unlimited tasting of samples, homogenization of identical samples, randomized sample placement, 33% chance to guess correct different sample, assessor must choose a sample even if they can’t identify a difference). Interestingly, for phycological reasons, through repetition the sensory perception of the tasters can change.
Preforming a combination of a Triangle Test and 3 AFC Test can yield interesting results. Triangle Test question: which one is different? 3 AFC Test question: which one is sweeter? For example, the taster could correctly identify the odd sample, but not identify it as the sweeter.
“If 13 (or 14, 15, etc.) assessors got the correct answer, then the assessors are able to detect the *specific attribute* substance with 95% (or 99% or 99.9%) statistical significance.”
Duo-Trio
Use: A combination of Pairwise (“duo”) and the Triangle (“trio”) tests, in this test reduces the phycological burden of the Triangle test and is good for samples with intense attributes. After familiarizing themselves with a control sample, tasters are given 2 samples and asked the general one-sided question – which one is the same as the control sample?
Application: The control sample is available to be revisited along side the other 2 samples, which again are numbered with a 3-digit code. Like the Pairwise test, assessors have a 50/50 chance. More testing is required than with the Triangle test. Through Thurstonian modelling, the size of the sensory difference can be explained, where 0=identical and increasing numbers mean increasing product difference.
A not A
Use: This test involves a control sample (‘A’), at least 2 different samples of which all, none, or some are strongly different from the control sample (with the rest being identical to the control sample), and asks the general one-sided question – which is ‘A’ (same as control sample) and ‘not A’ (different)?
Application: Once the assessor has become familiarized with the control sample, it is removed and the 6 samples (coded with a 3-digit number) are given to the assessor one after the other and in randomized orders. They go through each sample and decide if it is the same as the control, or different. This differs from the Triangle test in that the comparison is monadic, defined, something they’ve learned. This test doesn’t need to involve professional tasters, or many tasters for that matter, and is therefore more useful for identifying consumer preferences over science. It also involves quick decision making. The statistical calculation made is called the Chi-Squared Test, a test that measures the sum of the squared difference between observed data and the expected data. With the A not A Test this means the number of correctly identified and incorrectly identified ‘A’ sample and number of correctly identified and incorrectly identified ‘not A’ samples.


In terms of statistical significance, the values are depended on the X2 values. For example, if the value generated is greater than 6.63, it is significant with a 0.5% error that the panel could accurately identify the difference between ‘A’ and ‘not A’ samples. 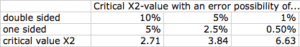
“If x2 is higher than the table, then the assessors are able to find the correct “A” (or alternatively the correct “not A”) sample with 95% (or 99% or 99.9%) statistical significance.”
In-Out
Use: This test differs from the others in that is it is concerned with testing quality control. For example, with TCA taint amounts, or acetic acid in wines. It can ask 3 different question: (1) Categorical: general one-sided question – is the sample inside my tolerance or outside my tolerance in respect to the control sample provided?; (2) Graduated: categorical + degree of divergence – well/just in or just/well out?; (3) Descriptive: graduated + why, based on attributes given?
Application: The assessors must first familiarize themselves with a control sample before it is removed and then the proceeding samples (coded with a 3-digit number) are provided for analysis. The application of this test can range from simple and quick to more time consuming. It also ranges from very little information provided to more complex answers depending on which question is asked.
Ranking Tests
Use: Ranking tests are concerned with ordering 2 or more samples according to either one-sided criteria where there is only one correct answer – e.g. rank according to the intensity; or two-sided opinion based – e.g. preference. These samples should have significant differences, otherwise the Triangle or Pairwise Comparison would work better. This system allows for fast pre-sorting. However, it is important to note that it does not evaluate the “level” of a difference between samples, only ordinal difference.
Application: The samples are provided in a randomized order and coded with a 3-digit number. The applications of this test range from testing the assessors’ ability, to comparing ingredients and processing changes, to gathering popularity and market information. This test uses the Latin Square method, where all possible combinations are distributed to the panel. You need a minimum of 7 trained assessors, or 30 untrained assessors (for hedonic examinations) to obtain enough statistical significance, but really you want at least 12 or 15 for better results. Place 1 is the sample having the most intensity. There are 2 variations to statistically analyze ranking tests: the Paul method and the DIN method.
Paul Statistical Analysis
After receiving 2 or more samples, the assessors are asked to put the samples in order according to the criteria specified. Assessors then justify their evaluation by explaining why each sample has obtained this place. Rank number values are then created and used for a Pairwise comparison to determine with 95% statistical significance if the assessors can tell a difference between the samples.

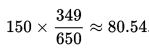
To obtain a result, you (1) multiply the ranking by the number of assessors (n = number of assessors = 30) to find the rank sum; (2) divide that number by the number of assessors to find the average place number; (3) find the rank number according to the following calculation:


When the difference between the rank number of samples is more than 1.0, you can say “assessors are able to find a difference between samples at 95% statistical significance.” (If it was a preference ranking assessment, than they prefer the samples at 95% or 99% significance.)
DIN Statistical Analysis
To analyze these results you also calculate for 99% or 95% statistical significance that the samples have significant sensory differences, but use rank’s sum instead of rank number for the comparison part. Like with the Paul method, this tests to see if the panel can tell a difference between each of the samples with statistical significance.
If the difference between the different samples’ rank’s sums is higher than the F-value listed in the table for 5% and 1% probability of error (according to how many samples were ranked), the answer to the statement is that “the panel could determine a difference between the samples at 95% (or 99%) statistical significance.” (Again, if it was a preference ranking assessment, than they prefer the samples at 95% or 99% significance.)

You can also do a Page Test when the panel can successfully rank the samples in the correct order (therefore only for one-sided tests, and also not too common) to determine the statistical reliability with which the correct order can be recognized by the panel.
Formula: L = R1 + 2xR2 + 3xR3 + 4xR4 … + XxRx
The calculated value is then compared with the values given in the table. If L is greater than or equal to the value in the table, it means that the ranking recorded by the panel does correspond to the specific order with 95% or 99% probability.
Quantitative Descriptive Analysis
Use: This type of sensory evaluation is concerned with why a sample is preferred over another. The aromas can be standardized or non-standardized. There are steps to follow for Quantitative Description Analysis to come to a final determination, as follows in the application section below.
An alternative is the Just About Right Scale, where on a scale of -3 to +3, this test asks you to judge the intensity level of specific attributes and whether you find them to be positive or negative in relation to the reference sample. -3 means lowest intensity and very positive, 0 is neutral, and +3 means highest intensity and very positive.
Application: Step one is to familiarize yourself with the reference sample, finding the sensorial characteristics in that sample and taking notes. You can utilize an aroma wheel to associate the reference sample with possible attributes and examples of descriptions for aid. Step two is to meet with other evaluators and discuss the reference sample and reduce the number of attributes found to a common and specific consensus. This can take a while (many meetings) to perfect the reference sample. Step three is to smell the aromas and evaluate the intensity, either comparatively (across one attribute for all samples) or mondically (down all attributes for one sample at a time).
In the case of wine, the reference sample could be Riesling and you could be given other wine varieties such as Chardonnay and Gewurztraminer in the test. This compares and contrasts the aromas of these wines, finding relationships.

You can then ask 3 questions from this information: What is the relationship between tasted samples? Between attributes? Between tasted samples and attributes?
You can evaluate these results through graphing (1-D, 2-D, or 3-D), finding the averages, and evaluating standard deviations. The PCA (Principle Component Analysis) condenses and simplifies data and looks into correlations of single variables (single aromas). One option is to chart the attributes of two main components after an initial graphing of the correlation of attributes of the wine. It takes seemingly correlated variables, combines them into one general group and compares them against each other. For example, if hay is rated high was grass also rated high? If so, vegetal could graphed on the x-axis, and say fruit in general on the y-axis to show the comparison. A positive or negative correlation correlation could be charted. The higher the PC%, the more significant variation detected. In a matrix of correlations, the degree of correlation is determined as follows:
R <0,2 = very low correlation; R <0,5 = low correlation; R <0,7 = mid correlation; R <0,9 = high correlation; and R <1,0 = very high correlation.

DLG schemes
These tests are specific to wine evaluation in Germany. Non-bias and trained assessors are vital, as well as anonymity of the wine being tested to avoid price and label as influencers, and reproducibility. These forms of tests can be hedonistic sensory evaluations (think happy face and sad face as evaluation options). All can be used in competitions to judge the wine, and one is currently used in Germany for legal wine assessment criteria.
20 Point
Use: From 1971 to 1984 this was used to test the German wine quality level rating. From Qualitatsweine at the lowest with 11-14 points, all the way to Qualitatsweine with Pradikat Trockenbeernauslese at 17-19 points. The scaling options are quite unclear and specific to tastes at the time this test was created.
Application: Colour (0-2 points), clarity (0-2 points), smell (0-4 points) and taste (0-12 points) are the attributes tested. Within each category there are minimum passing points. You rate the wines according to a yes/no response to each attribute option. If this is not achieved, the wine is disqualified. When all are passed, the results are added up and the final sum shows which quality rating level the wine falls within.
5 Point
Use: From 1984 to today, this is the test used to obtain the AP number needed for any German wine above table and land wine (i.e. all Qualitats QbA wine). It must receive 1.5/5 to obtain this AP number.
Application: Step one is to first test for the typicality of the wine being tested. The wine maker will submit their wine with the desired quality level noted and then the wine is tested for 6 preconditions: is it typical for the (1) vintage; (2) grape variety; (3) the quality level submitted; (4) wine growing region; (5) colour; and (6) clarity. This is a yes/no decision and it must pass all these before it can move on to the next step. If it does not pass these preconditions, if can be resubmitted under different (lower quality, cuvee. etc.) conditions. Step two is rating smell, taste, and harmony all on a scale of 1-5. It must reach a minimum of 1.5/5 for each attribute. All are weighted equal. Step three, the sum is added and you have the quality number and the AP number to print on the wine label.
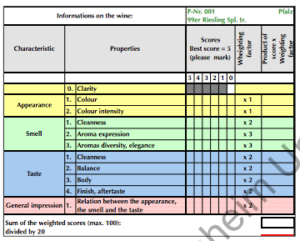
100 Point
Use: Used from 2000 to 2011, this test is used for awards, is closer to international standards, and goes further by requiring a justification of the evaluation. The wines are being evaluated against their own specific wine-variety characteristics. No justification of results are required.
Application: First, the wine must pass a yes/no question on the clarity. Then appearance (clarity x1, colour x1), smell (cleanness x2, aroma expression x3, aroma density/elegance x3), taste (cleanness x2, balance x2, body x2, finish x2), and general impressions (x2) are rated and weighted accordingly. “Not recommended” 50-75 points, “mediocre” 76-79, “good” 80-84, “very good” 85-89, “outstanding” 90-95, and “class/great wines” 96-100. These are kind of like Parker Points. The decision-making process is not as intensive as it seems, as it can really be simplified. Basically, you decide beforehand if the wine is good or not, then use the scheme to justify it. If the wine generally fulfills the questions, it can get 5 points. Reproducibility can be difficult.
New 5 point
Use: From 2011 to today, this is like the older 5 Point test used to obtain the Germany wine AP number, but is used for competitions. The wine must have received at least 2.5/5 in the AP rating to then be tested for a German Seal: 3.5/5 bronze, 4/5 silver, 4.5/5 gold. If 5 points are not awarded per category, the assessor must explain why. “Deviation from maximum quality” drives the decision. This test is too complicated for beginners.
Application: There are 4 categories: colour/appearance (weighted x2), smell (x6), taste (x6), and typicality (x6), for a total of 100 points ÷ 20 gives you a quality level out of 5. Within each section are a myriad of possible considerations to help you decide by how much the wine has deviated from the maximum potential (off aromas and flavours, etc). 4-5 assessors are used to taste and justify scores. To ensure reproducibility, assessors are tests with the same sample set throughout the day, and only those who score then within +/-0.5 point consistently remain as assessors.
Pfew! That was a long one! Wish me luck on my sensory evaluation exam! And if you find any information inaccuracies, do not hesitate to let me know. I’m learning! 🙂
Note: Please note that some images have been obtained from Dr. Rainer Jung, Hochschule Geisenheim Univerity “Introduction to Sensory Evaluation” lecture slides. Thank you!

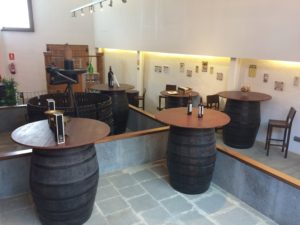
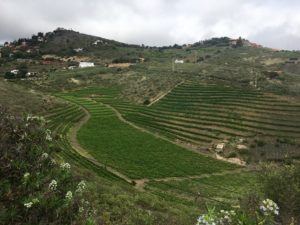
 Wine and travel is a fascinating combination. The stories of the vines and wineries can tell a micro-story of the whole place – of the history, anthropology, politics, technological growth, and social development of the region. Not only is this a great reason for anyone to learn more about wine (and take some sips along the way), but it means that wine tourism can be a highly educational and insightful way to spend vacations. Score!


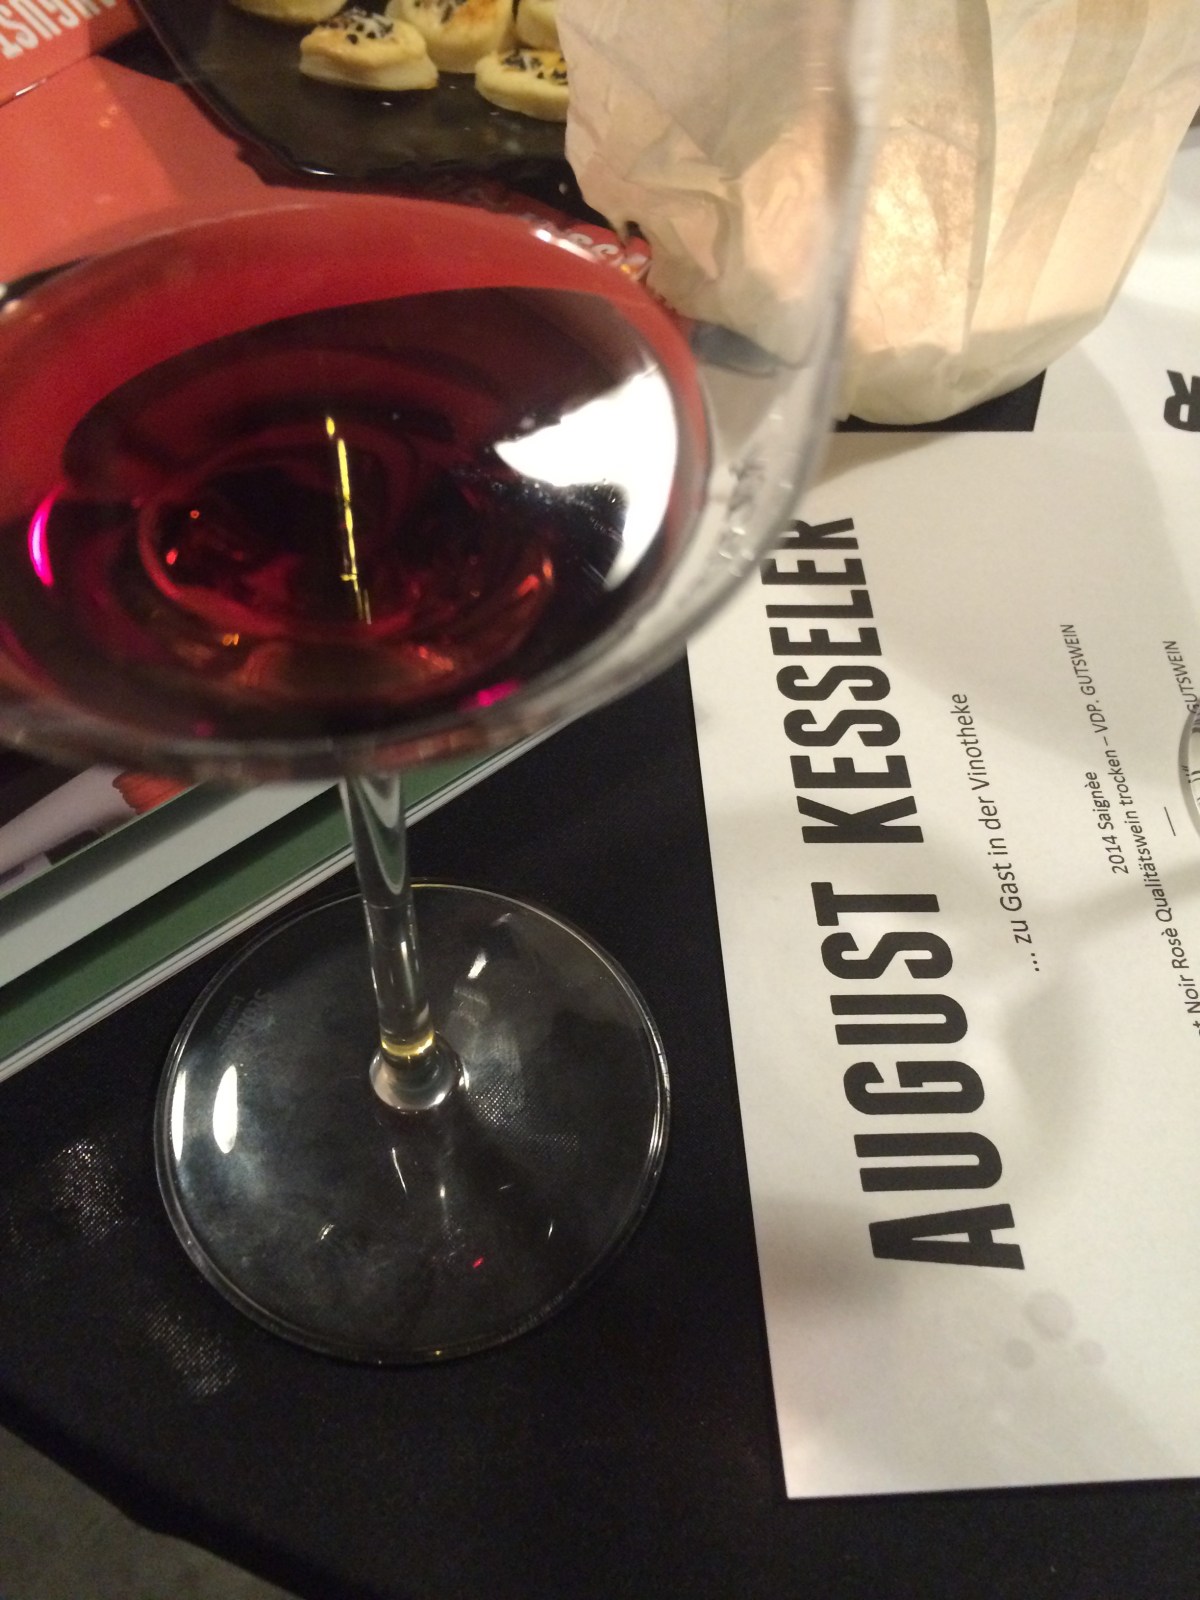
 2014: Smooth, fading flint, very tart, wet rock, faint fruit – hints of banana and barely ripe peach.